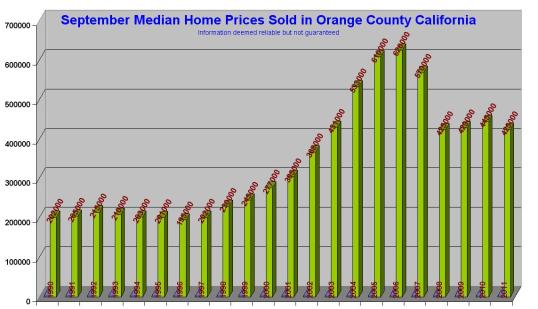
Orange County California September Median Home Prices Sold Since 1990

Orange County California September Median Home Prices Sold Since 1990.

The decision to pursue homeownership may be based on many factors: everything from a friend’s decision to purchase a home or a family member’s advice against “throwing your money away on rent” to your bad experience with a landlord or the noisy neighbors sharing your wall. While all of those scenarios (minus peer pressure, of course) may inspire valid arguments for considering the purchase of a home, how do you determine if you’re genuinely ready to join the ranks of homeowners? After all, buying a home is a massive decision and includes multiple, long-term financial and lifestyle obligations. The average person spends around 1/3 of their income on their home. You’ll still need to do the work to make sure your personal finances and holistic life picture are also in alignment before you buy, as well of the work it takes to ensure that your real estate and mortgage decisions are sustainable and smart, over the long-term. A good Buyer’s Agent is invaluable to a Buyer, and can be the difference between a wonderful transaction, and a nightmare.


Selling a house is a complicated process, no matter how good the real estate market is. Whether you’re a first-time home seller or not, you’ll probably need the answer to a bunch of questions for yourself. How should I prepare the house for sale? How can I get the best price for my house? What is the best marketing strategy for your situation? The fact of the matter is that fully three quarters of homesellers don’t get what they want for their home.  It’s best to list your home at a price that buyers will perceive as a good value. Overpriced listings sit on the market.  Real estate agents and buyers forget about them.  Fortunately there is a way to overcome this problem!  I am an expert in a marketing strategy that lets you price a home in a competitive way as well as getting you the maximum possible selling price!

Orange County California September Median Home Prices Sold Since 1990
This chart gives you a great idea of how the Real estate market has behaved during more than a decade and what is its current status:


||

||

\\//

.

<<<>>>   Check my  WEBSITE & BLOG  for more details   <<<>>>

Scared of not getting the maximum possible price from the sale of your home!

Scared of not getting the maximum possible price from the sale of your home!

Here is a proven way to avoid losing the money you deserve.  This pricing strategy determines market value effectively and eliminate the risks for under pricing.  There are some concerns and questions that needs to be addressed and made clear to all the parties involved.  The listing agent should be able to provide guidance, apply an informative approach, and must have the  vision to satisfy the:

  • Seller on how this method works and how we must respond to the buyer’s offers,
  • Buyers (sometimes even their agent)  on why this system is more beneficial to them and why there is no fixed pricing,
  • Multiple Listing Service provider’s pricing rules in a thoughtful and acceptable manner to the MLS.  This requires an in depth knowledge of the MLS rules and regulations.

Setting a correct range based on the specific situation of your home has enormous effect on the selling process  and achieving the goals of this pricing method.  This is not a job for just any real estate agent, it must be handled by an  experienced and trained real estate professional  in order to fulfill the desired results.


|

|

\/

<<<>>>   Check my  WEBSITE & BLOG  for more details   <<<>>>

Selling a house in an unstable market or when there are no comps!

Selling a house in an unstable market or when there are no comps!

Selling a house is a complicated process, no matter how good the real estate market is. Whether you’re a first-time home seller or not, you’ll probably need the answer to a bunch of questions for yourself. How should I prepare the house for sale? How can I get the best price for my house? What is the best marketing strategy for your situation? The fact of the matter is that fully three quarters of homesellers
don’t get what they want for their home. It’s best to list your home at a price that buyers will perceive as a good value. Overpriced listings sit on the market. Real estate agents and buyers forget about them. Fortunately there is a way to overcome this problem! This pricing strategy is very effective specially if the market is in an upward or downward trend with no stability. You need a Real Estate Professional who is an expert in handling this marketing strategy. This strategy lets you price a home in a competitive way as well getting you the maximum possible selling price, if it is implemented properly! Higher end Multi Million Dollar homes with plenty of upgrades and unique features have seldom any realistic comps!


|

|

\/

<<<>>>   Check my  WEBSITE & BLOG  for more details   <<<>>>

When will the housing market be “corrected?”

When will the housing market be “corrected?”
The housing recovery in California is expected to continue through to 2013, but the market won’t be “corrected” until as far off as 2017, according to the California Housing Market Forecast released by the CALIFORNIA ASSOCIATION OF REALTORS…

|

|

\/


<<<>>>   Check my  WEBSITE & BLOG  for more details   <<<>>>

Overcoming the “Under or Overpricing” Trap

Overcoming the “Under or Overpricing” Trap

How Sellers can make sure their home is not “under or over priced”? There are huge risks for the seller if the pricing is not right, which often times is what the buyers are willing to pay and what the home is really worth, when selling a property.  Sellers should not lose money by under-pricing their home and they should not lose money by overpricing which can have the same negative impact on the outcome of how much will be the result of the sale. This is a real concern especially if the home has some unique features and there are no similar properties for comparison and pricing it right! Fortunately there is a proven way to overcome this problem and to price a unique and often highly upgraded luxury home . Of course, you’ll need a real estate professional who has been trained to handle the concerns of the parties involved.  The agent should be able to provide guidance to the seller, the buyers, and should know how the MLS works. The agent must make sure, the following goals are achieved in the transaction:
  • Increases property visibility
  • Attracts more buyers to the property
  • Maximizes selling price
  • Determines market value effectively


And must make sure it makes sense to all the parties involved.  Seller should be advised on how to respond to the offers,  Buyers should understand why this system is more beneficial to them and the MLS concerns should be addressed in a thoughtful and acceptable manner.

<<<>>>   Check my  WEBSITE & BLOG  for more details   <<<>>>

Cycles of the Real Estate Market

Cycles of the Real Estate Market
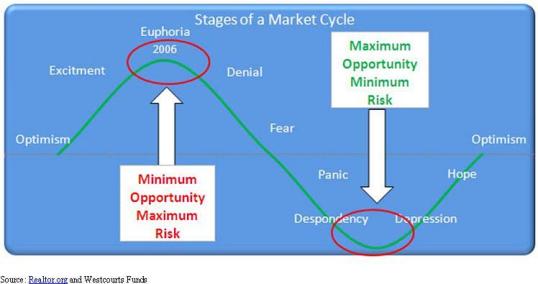
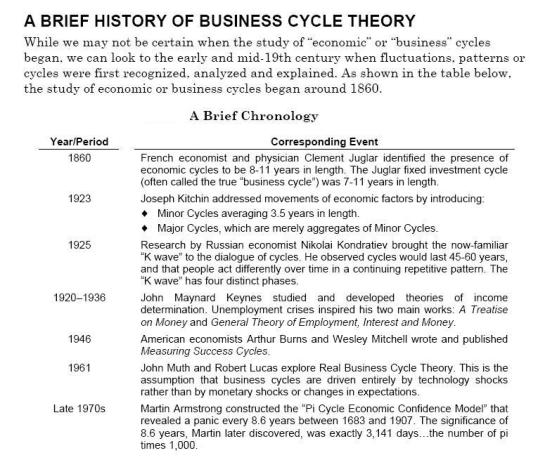
We have all heard about business, and Real Estate market roller coaster rides or cycles but what does that really mean?  The following images show the typical stages of a market cycle and a brief history of business cycles:


When it comes to Real estate there are theories and researches that can be used as a guide. We should never forget that Real Estate is local and these information might only be used to help us get a better general understanding and in no way should replace the local market indicators.  One of the famous theories is The Great 18-Year Real Estate Cycle:


The most recent real estate bubble in the U.S. is the largest in our history and there has been no pleasure in taking this ride for anybody.  Losing an average of $70,000 per household and over 9,000,000,000,000 as a country is an unwanted set back for many of the homeowners!  Following chart shows the effects of the bubble in the last 5 years in my local area.


<<<>>>   Check my  WEBSITE & BLOG  for more details   <<<>>>


2011-12 Cost vs. Value: Interactive Map for Remodeling Projects

2011-12 Cost vs. Value: Interactive Map for Remodeling Projects

Find out which remodeling projects will provide the biggest bang for your buck this year. Fortunately, you can see the information at National, Reginal or Area level.

Optimizing the use of space in a home will not only attract buyers but also give sellers more bang for their buck, according to Remodeling’s “2011–12 Cost vs. Value Report,” conducted in cooperation with REALTOR® Magazine and NAR’s HouseLogic.com

.The report looks at the estimated cost and expected resale return of 35 midrange and upscale remodeling projects in 80 markets. The estimated costs and returns were derived from a survey of more than 3,000 REALTORS® conducted last summer. As in past years, REALTORS® picked exterior projects to recoup the most at resale…

<<<>>>   Check my  WEBSITE & BLOG  for more details   <<<>>>
Real Estate market accelerating in all areas

Real Estate market accelerating in all areas
CoreLogic’s September MarketPulse report, a monthly economic publication that provides insight into the current and future health of the U.S. economic climate with emphasis on housing and mortgage metrics, found that while robust economic growth remains elusive, the housing market is accelerating in all areas. Home sales are up, mortgage performance is improving, and prices are rapidly improving.

Land is a critical cyclical component that drives home values. Currently land share of total home value is historically low, but if land sales begin to increase rapidly, home prices could rise more quickly than traditional income and rent-to-price fundamental indicators warrant, and would contribute to overall economic growth.

The newly introduced CoreLogic Real Estate Strength Index (RESi™), is a monthly index that compares and ranks the quality, sustainability and health of metropolitan markets by incorporating economic, real estate and mortgage factors.

According to RESi, the majority of the most-improved U.S. housing markets are in western markets, which peaked and bottomed earlier than many eastern and southern markets. Boise, Idaho, holds the top spot for most improved, followed by Phoenix, Ariz. and West Palm Beach, Fla…

<<<>>>   Check my  WEBSITE & BLOG  for more details   <<<>>>
For-sale listings drop again, led by California cities

For-sale listings drop again, led by California cities
Inventories fell in August by 1.2 percent from July, bucking a seasonal pattern of a slight uptick before the summer season ends. Listings were down by 18.7 percent from one year ago and 34.1 percent from two years ago, according to a report from Realtor.com…

<<<>>>   Check my  WEBSITE & BLOG  for more details   <<<>>>

Orange County Real Estate and Homes For Sale – Aug. ’12

(Orange County) Chart Definitions & Analysis:
Month’s Supply of Inventory (MSI)– Thischart showsthe time, in months, that it would take to “sell” the remaining inventory for the month in question. This metric is a “one number summary” of how market supply and demand are changing from month to month. (0-3months– indicate that supply & demand are converging, 4-6 months – indicate that S&D are in balance, 7+ months – indicate that S&D are diverging). This month shows a decrease compared to the last month.
Median for sale Price vs. Median sold price– Thischart showsthe median price of properties listed For Sale (a measurement of seller expectations) compared with the median price of properties that have successfully Sold (a reflection of buyer activity) during the time period chosen. The difference in these two median prices speaks volumes about how buyers and sellers perceive the same set of market conditions. In a balanced market most properties “sell” within 10% of their “final” list price. This month shows an increase on Median Sold Prices as well as the Market Expectation compared to the last month.
The Number of New Properties Listed by Month– Thischart showsthe number of the properties that came into the market each month for the time period chosen. This metric is a leading indicator of the “rate” at which new inventory is entering (resupplying) the market. A useful exercise is to compare it with the “rate” at which properties are leaving the market (the number of under contract properties which represent current demand). This month shows a decrease compared to the last month.
The Number of Under Contract Properties by Month– Thischart showsthe number of properties that went under contract each month during the time period chosen (a buyer and seller have successfully negotiated a purchase contract and have opened escrow). This metric is a direct measure of current sales activity and a leading indicator of market demand. This month shows an increase compared to the last month…


<<<>>>   Check my  WEBSITE & BLOG  for more details   <<<>>>